Analysis
Each party's 2026 vote compared with 2024, county by county, in five states
In all 507 counties, Republicans got a smaller share of Trump's 2024 vote than Democrats got of Harris's. Equal turnout would need 22 percent of Trump voters to switch.
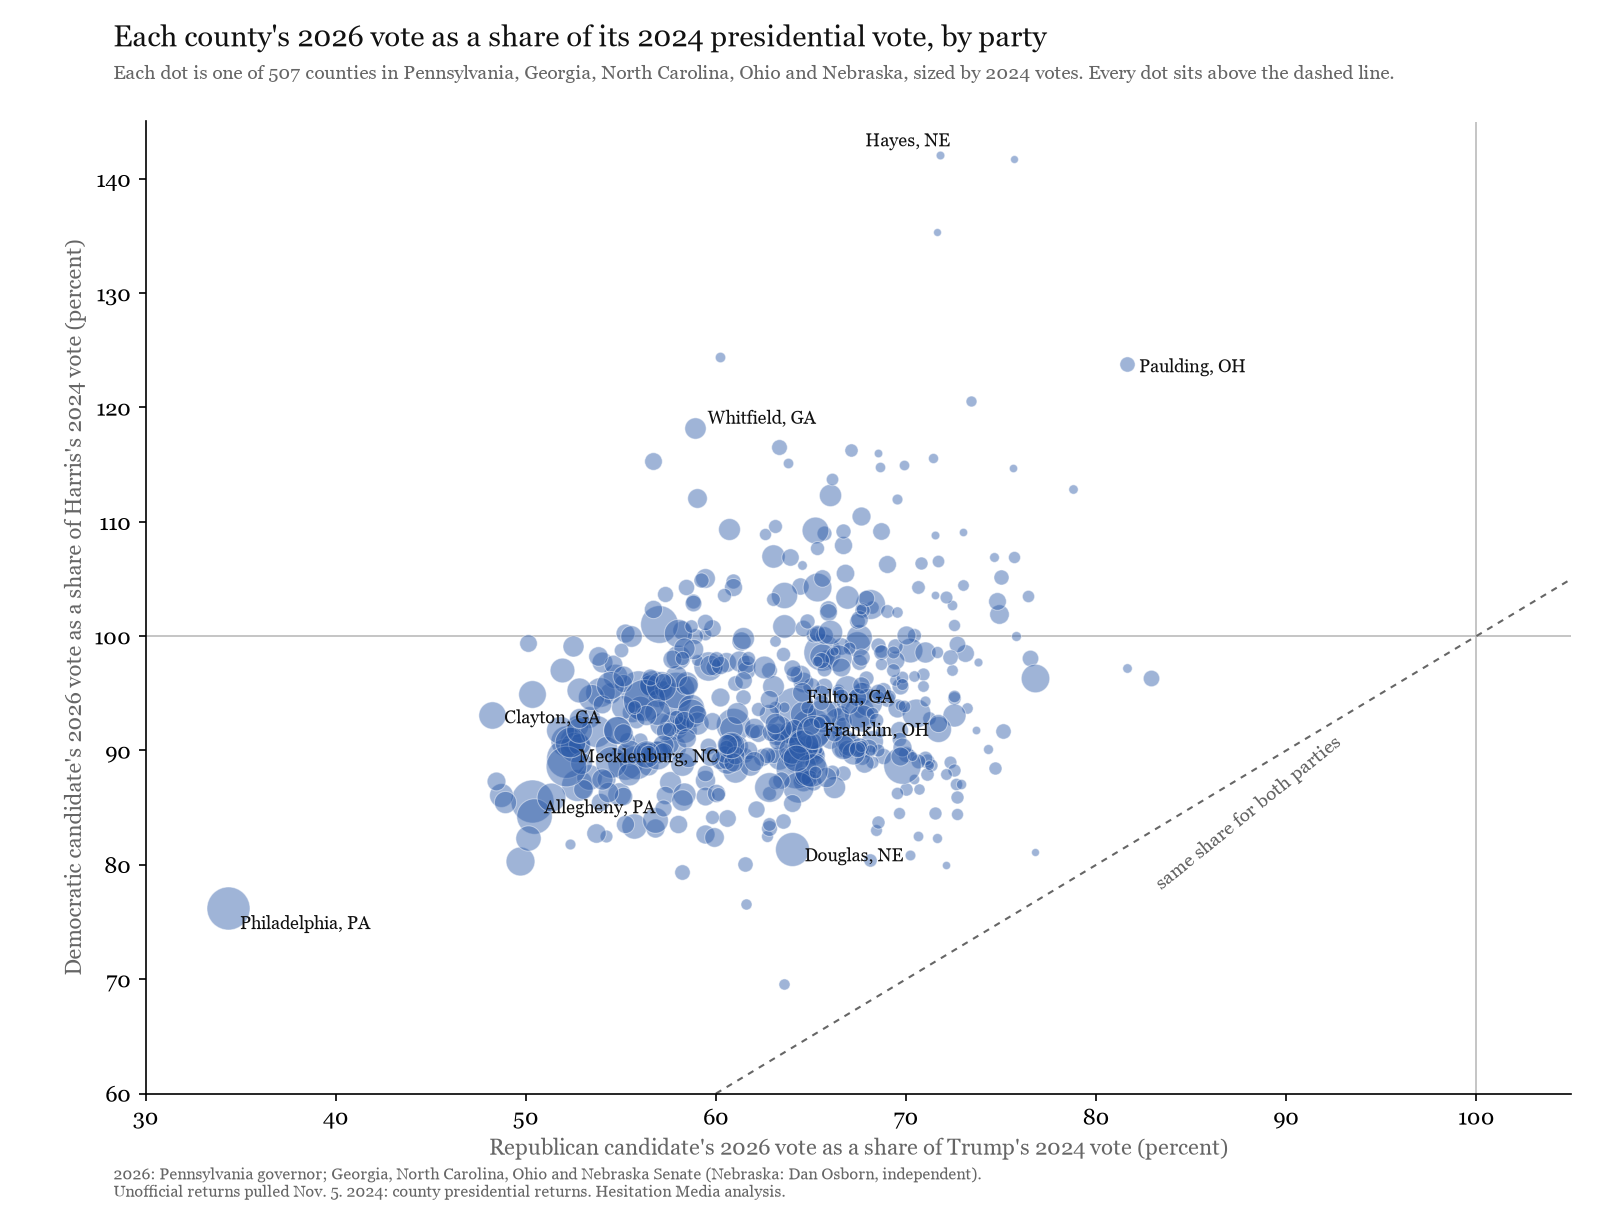
In every one of the 507 counties in the five states Hesitation Media has scored, the Republican candidate received a smaller share of the 2024 vote for Donald Trump (R) than the Democratic candidate received of the vote for Kamala Harris (D). Across the five states, Republican candidates received 60.0 percent of Trump’s vote and Democratic candidates, with Dan Osborn (I) in Nebraska, 91.1 percent of Harris’s.
Vice President JD Vance (R) said in a post on Nov. 4 that Republican voters turned out and that 2024 Trump voters switched to Democrats (our check of that post). Because county returns do not follow individual voters, they can show only which combinations of turnout and switching could produce the totals. If Trump and Harris voters had turned out at the same rate, about 22 percent of Trump’s voters would have had to vote for the Democrat or Osborn. The NBC News Exit Poll found that 6 percent of 2024 Trump voters nationally backed Democratic House candidates. At 6 percent, about 61 percent of Trump’s 2024 voters in these states cast a ballot in these races, against about 90 percent of Harris’s.
Each state
| State and race | Democrat or independent, share of Harris 2024 | Republican, share of Trump 2024 | Votes cast, share of 2024 | Switching needed for equal turnout |
|---|---|---|---|---|
| Pennsylvania governor | 87.8% | 53.8% | 70.8% | 26.6% |
| Georgia Senate | 96.7% | 64.3% | 79.5% | 22.7% |
| North Carolina Senate | 90.9% | 56.7% | 74.0% | 25.4% |
| Ohio Senate | 90.8% | 65.3% | 79.8% | 17.1% |
| Nebraska Senate (Osborn, I) | 87.2% | 66.1% | 78.1% | 13.2% |
| All five | 91.1% | 60.0% | 75.8% | 22.4% |
How the estimate works
Two numbers are unknown: how many of each candidate’s 2024 voters voted this year, and how many changed sides. The county totals give two equations, one for each party’s 2026 vote, and four things are unknown: each group’s turnout and each group’s switching rate. Fixing the switching rates at the exit poll’s 6 percent of Trump voters and 3 percent of Harris voters gives the turnout of each group. Fixing equal turnout and the 3 percent of Harris voters who vote Republican gives the share of Trump voters who would have to switch.
Both calculations treat every 2026 voter as someone who voted for Trump or Harris in 2024. People who did not vote in 2024, or voted for someone else, cast some of this year’s votes. If those new voters leaned Republican, the gap in turnout between Trump and Harris voters was larger than these figures show, and it was smaller if they leaned Democratic. The exit poll is national, covers House races and is reweighted as counts finish.
The county range
The middle county gave the Democrat or Osborn 93.3 percent of Harris’s 2024 vote and the Republican 64.1 percent of Trump’s. The two shares were closest in Blaine County, Neb., at 81.1 and 76.8 percent.
In 97 counties the Democrat or Osborn received more votes than Harris did in 2024, 49 of them in Georgia and 33 in Nebraska. In those counties at least some of this year’s votes for the Democrat or Osborn came from people who did not vote for Harris. Hayes County, Neb., where Osborn received 27 votes to Harris’s 19, or 142.1 percent, and Paulding County, Ohio, where Sherrod Brown (D) received 123.8 percent, are among them. Across all 97, those votes beyond Harris’s total add up to 23,264, against the 5.1 million votes by which Republican candidates fell short of Trump’s 2024 totals in the five states.
Philadelphia had the lowest Republican share. Stacy Garrity (R) received 34.3 percent of Trump’s 2024 vote there, and Josh Shapiro (D) received 76.2 percent of Harris’s.
Changelog
- Published with unofficial 2026 county returns pulled the morning of Nov. 5, with feed timestamps from Nov. 4 and 5, and 2024 county presidential returns.
Hesitation Media sends new records to the newsletter first. Subscribe on Substack.