Analysis
What 2018 and 2022 say to watch on Nov. 3, county by county
In 13 of 14 midterm comparisons, larger counties tended to swing further toward Democrats from 2018 to 2022. The counties to watch in each 2026 Senate battleground.
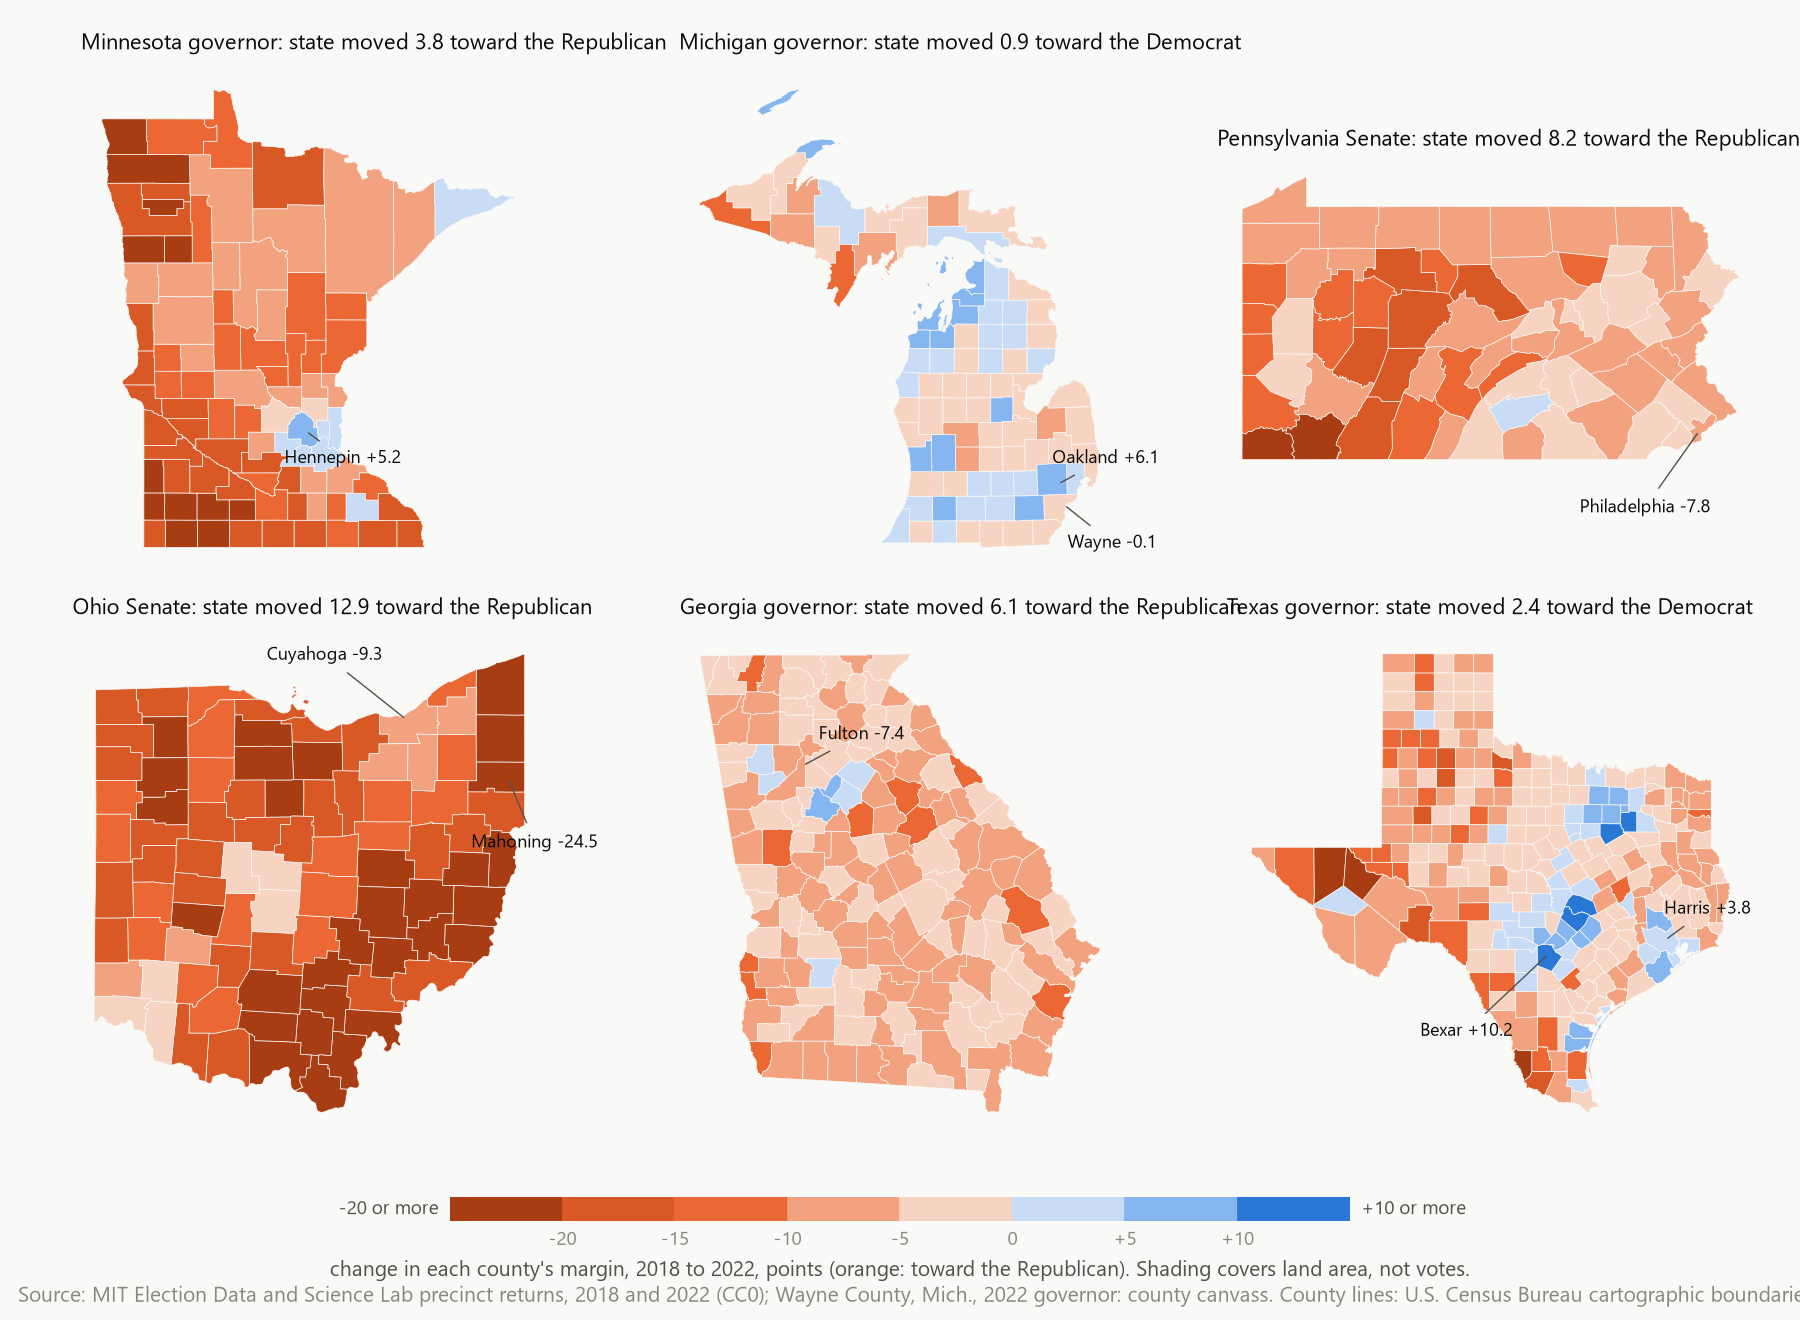
Tim Walz’s margin in the Minnesota governor’s race fell from 11.4 points in 2018 to 7.7 in 2022. In 78 of the state’s 87 counties it fell by more than it did statewide, and in the median county it fell 13.1 points. Hennepin County, which cast 575,529 votes for governor in 2022, 23 percent of the state’s total, moved 5.2 points in his direction.
The MIT Election Data and Science Lab publishes precinct returns for both midterms. Set against each other for the 13 states with 2026 Senate battlegrounds and Pennsylvania, they show a similar pattern. Each county’s 2022 vote total, on a log scale, was compared with its swing between the two midterms in 14 comparisons: the governor’s races in 12 states plus the Ohio and Pennsylvania Senate races. In 13 of the 14, larger counties tended to swing further toward the Democrat. The correlation ran from 0.85 in South Carolina and 0.79 in Minnesota down to 0.14 in the Ohio governor’s race, and in Nebraska it was slightly negative, at -0.05.

Every one of these comparisons pairs different candidates, so a county’s swing mixes the national climate with whatever the 2018 and 2022 nominees brought to it. Ohio and Pennsylvania held Senate races in both years, for different seats, and the other 12 comparisons are governor’s races. North Carolina is absent from the 14 because it held no statewide race in 2018, and Alaska is left out because its 2022 governor’s race had two Republicans in the first-round count and its house districts, the only sub-state unit in its returns, were renumbered in 2021.
Texas
Greg Abbott beat Lupe Valdez by 13.3 points in 2018 and Beto O’Rourke by 10.9 in 2022, a swing of 2.4 points toward the Democrat. Of Texas’ 254 counties, 225 swung less toward O’Rourke than the state did or swung away from him, and the median county moved 3.6 points toward Abbott. In Bexar County, which cast 541,071 votes, the margin went from 6.3 points for Valdez to 16.5 for O’Rourke, and the county’s net Democratic vote grew by 54,663, or 24 percent of the statewide change. Tarrant, Travis and Harris supplied another 53 percent between them.
Ohio and Pennsylvania Senate races
Sherrod Brown won Ohio’s 2018 Senate race by 6.8 points. Tim Ryan lost the 2022 race to J.D. Vance by 6.1. None of Ohio’s 88 counties moved toward the Democrat between the two races. Cuyahoga County cast 483,310 votes in 2018 and 408,543 in 2022, a drop of 15.5 percent, and the Democratic margin there fell from 45.0 points to 35.6. The county’s net Democratic vote shrank by 71,802, which is 13 percent of the statewide shift of 553,574 net votes and the largest share of any county. In Mahoning County, which includes Youngstown, the margin went from 21.0 points for Brown to 3.5 points for Vance.
Bob Casey won Pennsylvania’s 2018 Senate race by 13.1 points, and John Fetterman won the 2022 race by 4.9. Statewide, votes cast rose 7.1 percent, from 5,009,890 to 5,366,638. Philadelphia’s fell 10.1 percent, from 554,507 to 498,531, and its margin fell from 74.8 points to 67.0. Philadelphia accounts for 80,954 of the 394,240 net votes the Democratic margin lost between the two races, about a fifth. Cumberland was the one county of 67 that moved toward the Democrat, by 1 point.
Pennsylvania elects only a governor on Tuesday. In the governor’s race, Philadelphia gave Tom Wolf a 75.7-point margin in 2018 and Josh Shapiro a 72.6-point margin in 2022, and its share of the statewide vote fell from 11.1 percent to 9.3.
Michigan
Gretchen Whitmer won the governorship by 9.6 points in 2018 and by 10.2 in 2022, and her statewide net vote grew by 44,884. In Oakland County her margin went from 17.0 points to 23.1, adding 42,784 to her net. Wayne County, which includes Detroit, cast 53,715 fewer votes than in 2018 and subtracted 25,033. The state’s other 81 counties added 27,133 between them. MEDSL’s 2022 Michigan file sums to 4,431,811 votes for governor and gives Whitmer 54.24 percent, against 54.5 percent in RealClearPolitics’ final result, so the Michigan figures here may run slightly short.
Minnesota precincts
Of 4,074 Minnesota precincts in 2022, 3,776 carry the same county and name as a 2018 precinct, and together they cast 87 percent of the 2022 vote for governor. Among the 476 of those precincts in Hennepin and Ramsey counties, the median swing was 5.2 points toward Walz; weighted by votes, the swing was 3.6 points, and 27 percent of the precincts moved toward Scott Jensen. Among the other 3,268 precincts with at least 10 votes, the median swing was 11.8 points away from Walz, and 84 percent moved toward Jensen.

A matching name is not proof of an unchanged boundary, and these precinct figures have not yet been checked against precinct maps.
Counties to watch
The table lists, for each 2026 Senate battleground, the two counties that cast the most votes in 2022 and their margins in the closest comparable race of each cycle. Where the same office was on the ballot in both years, it also names the county whose change in net votes moved the statewide result most. The full sheet, every county in all 14 states with its share of the statewide vote, is data/baselines/benchmarks_2026.csv. The community type is the American Communities Project’s 2023 classification of each county. Alaska is left out for the reasons above.
| State | County | Community type | 2018 margin | 2022 margin | Share of 2022 vote | Why it is listed |
|---|---|---|---|---|---|---|
| Georgia (governor 2018, Senate 2022) | Fulton | Big Cities | +45.7 | +49.0 | 10.6% | most votes cast, 2022 |
| Cobb | Urban Suburbs | +9.6 | +16.3 | 7.9% | most votes cast, 2022 | |
| Iowa (governor 2018, Senate 2022) | Polk | Urban Suburbs | +18.3 | +12.7 | 15.7% | most votes cast, 2022 |
| Linn | Middle Suburbs | +14.0 | +9.0 | 7.7% | most votes cast, 2022 | |
| Kansas (governor 2018, Senate 2022) | Johnson | Exurbs | +16.7 | +1.3 | 26.1% | most votes cast, 2022 |
| Sedgwick | Big Cities | +6.0 | -20.8 | 15.3% | most votes cast, 2022 | |
| Maine (governor 2018, governor 2022) | Cumberland | Exurbs | +26.4 | +40.2 | 24.0% | most votes cast, 2022; moved the statewide net most (+24,430 votes) |
| York | Graying America | +6.7 | +18.3 | 15.5% | most votes cast, 2022 | |
| Michigan (Senate 2018, governor 2022) | Oakland | Urban Suburbs | +13.7 | +23.1 | 14.2% | most votes cast, 2022 |
| Wayne | Big Cities | +40.1 | +42.7 | 13.7% | most votes cast, 2022 | |
| Minnesota (Senate 2018, governor 2022) | Hennepin | Big Cities | +49.3 | +43.5 | 22.9% | most votes cast, 2022 |
| Ramsey | Big Cities | +52.7 | +46.4 | 8.7% | most votes cast, 2022 | |
| Nebraska (Senate 2018, governor 2022) | Douglas | Big Cities | +4.0 | +5.0 | 28.6% | most votes cast, 2022 |
| Lancaster | College Towns | +11.7 | +4.1 | 17.1% | most votes cast, 2022 | |
| New Hampshire (governor 2018, Senate 2022) | Hillsborough | Exurbs | -9.7 | +8.7 | 27.8% | most votes cast, 2022 |
| Rockingham | Exurbs | -14.2 | +3.1 | 24.9% | most votes cast, 2022 | |
| Ohio (Senate 2018, Senate 2022) | Franklin | Big Cities | +37.4 | +32.5 | 10.3% | most votes cast, 2022 |
| Cuyahoga | Big Cities | +45.0 | +35.6 | 9.9% | most votes cast, 2022; moved the statewide net most (-71,802 votes) | |
| South Carolina (governor 2018, Senate 2022) | Greenville | Urban Suburbs | -16.0 | -33.2 | 10.5% | most votes cast, 2022 |
| Charleston | College Towns | +14.9 | -4.9 | 9.0% | most votes cast, 2022 | |
| Texas (Senate 2018, governor 2022) | Harris | Big Cities | +16.7 | +9.6 | 13.6% | most votes cast, 2022 |
| Dallas | Big Cities | +33.0 | +26.8 | 7.7% | most votes cast, 2022 | |
| North Carolina (no 2018 statewide race; Senate 2022) | Wake | Big Cities | +26.6 | 12.0% | most votes cast, 2022 | |
| Mecklenburg | Big Cities | +32.5 | 9.5% | most votes cast, 2022 |
Margins are the Democrat’s share minus the Republican’s, in points of all votes cast in the race. In Michigan, Minnesota, Nebraska and Texas the 2018 column is the state’s Senate race that year and the 2022 column is the governor’s race, because none of the four held a Senate race in 2022. In Georgia, Iowa, Kansas, New Hampshire and South Carolina it runs the other way: none held a Senate race in 2018.
Polls and forecasts
FiveThirtyEight’s election-eve forecasts in 2018 missed the final margin by 3.1 points on average across 20 Senate and governor’s races in these states. The Democrat beat the forecast in 12 races and fell short in eight, and the signed misses averaged out to -0.04 points. Where the forecasts overstated the Democrat, the largest misses came in Michigan, Ohio and Iowa. FiveThirtyEight forecast a 14.3-point win for Debbie Stabenow in Michigan’s Senate race; she won by 6.5. It forecast 13.2 points for Brown in Ohio; he won by 6.8. It forecast a 1.9-point win for Richard Cordray in Ohio’s governor’s race, which Mike DeWine won by 3.7, and a 2.0-point win for Fred Hubbell in Iowa’s, which Kim Reynolds won by 2.7. In the governor’s races in Texas, Kansas and South Carolina, the Democrats beat their forecasts by between 5.1 and 7.3 points.
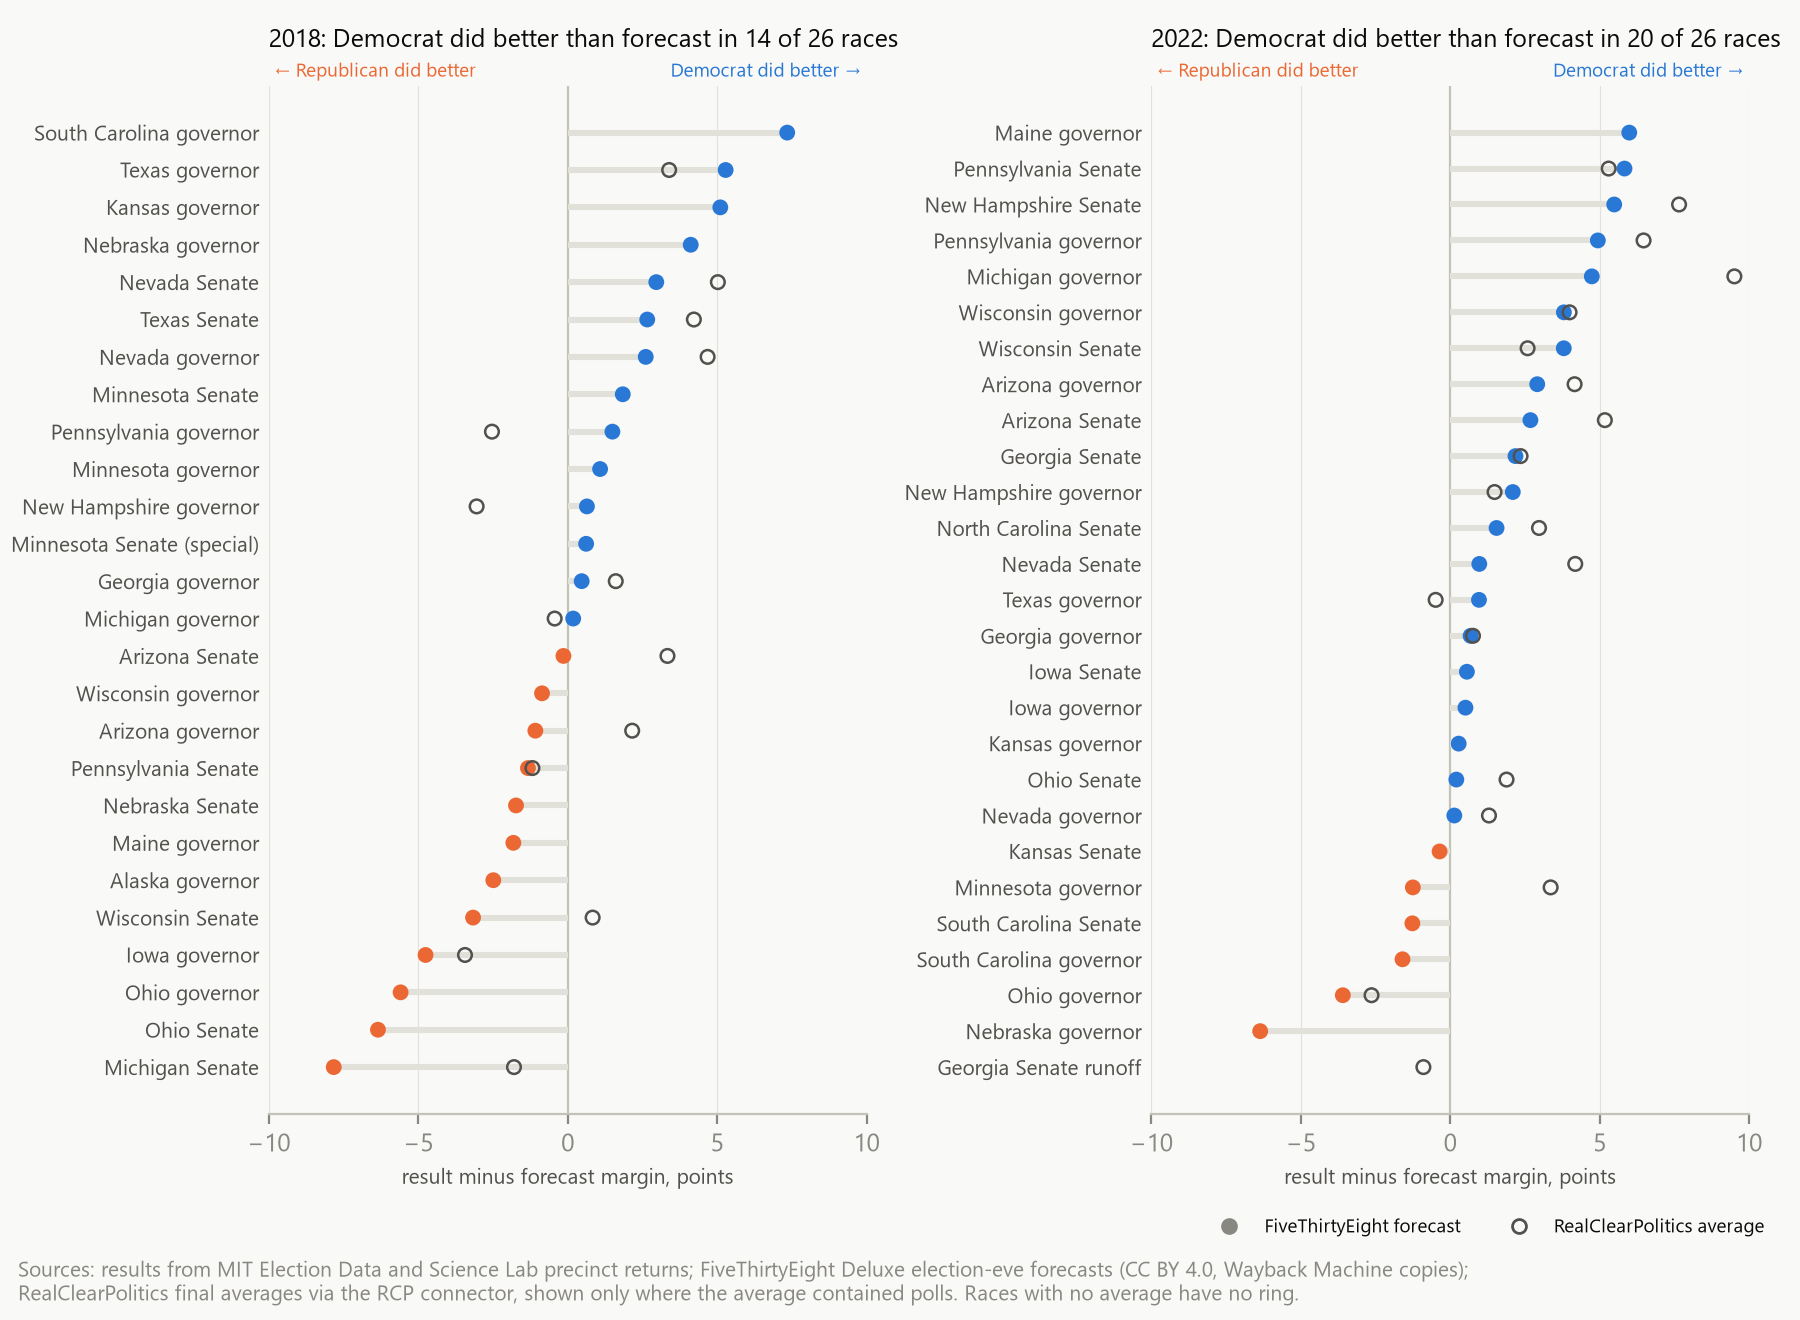
In 2022 the polls overstated the Republican. RealClearPolitics’ final averages understated the Democrat in 10 of the 13 races where the average contained polls, and across all 13 the average miss was 2.9 points in the Democrat’s favor. Its average had Whitmer ahead by 1.0 point; she won by 10.2. It had Maggie Hassan ahead by 1.4 in New Hampshire’s Senate race; she won by 9.1. It had Mehmet Oz ahead of Fetterman by 0.4; Fetterman won by 4.9. FiveThirtyEight’s forecasts, which combine polls with other inputs, understated the Democrat in 14 of 20 races, and across all 20 the average miss was 1.1 points in the Democrat’s favor. Of the six races that broke toward the Republican, the largest misses came in two governor’s races: DeWine beat FiveThirtyEight’s forecast by 3.6 points in Ohio, and Jim Pillen beat it by 6.4 in Nebraska.
Before the 2022 vote, RealClearPolitics’ average had Walz ahead by 4.3 points, and FiveThirtyEight forecast an 8.9-point win. He won by 7.7, with Hennepin County adding 10,130 to his net vote while casting 51,133 fewer votes for governor than it had in 2018, and with the state’s other 86 counties, taken together, subtracting 113,113.
Notes and sources
File names in this section refer to the project’s working data files, which are not yet public. The data and code are available from the author on request.
All results come from the MIT Election Data and Science Lab’s precinct returns: Precinct-Level Returns 2018 by Individual State (doi:10.7910/DVN/NVQYMG) and Precinct-Level Returns 2022 by Individual State (doi:10.7910/DVN/UYQIEP), both CC0, aggregated to counties by pipeline/clean.py. The comparisons, correlations and benchmarks are the author’s analysis of those returns. Margins count every vote cast in the race, third-party votes included. File-level hashes, coverage and known gaps are in data/MANIFEST.md; definitions are in docs/METHODS.md. An independent review of draft 1 recomputed 30 figures from these files: docs/REVIEW-draft1.md.
| Passage | Figures | File |
|---|---|---|
| Minnesota lede and close | statewide 11.42 and 7.66; 78 of 87 counties; median county -13.1; Hennepin votes 626,662 and 575,529, margin 38.38 to 43.54, net change +10,130; statewide net change -102,983 | data/baselines/cycle_change.csv (state MN, office GOV) |
| Correlations | log 2022 votes against swing: SC 0.85, MN 0.79, OH governor 0.14, NE -0.05; positive in 13 of 14 | cycle_change.csv; printed on each panel of fig. 1 |
| Texas | statewide -13.30 and -10.88; 225 of 254 counties; median -3.6; Bexar 6.30 to 16.45 on 541,071 votes, 24.0 percent of net change; Tarrant 18.7, Travis 18.3, Harris 16.0 percent | cycle_change.csv (TX, GOV) |
| Ohio | statewide +6.81 and -6.11; 0 of 88 counties toward D; Cuyahoga 483,310 and 408,543 votes, 44.98 to 35.64, net -71,802 (13.0 percent of -553,574); Mahoning 20.98 to -3.46 | cycle_change.csv (OH, SEN) |
| Pennsylvania Senate | statewide 13.12 and 4.90; votes 5,009,890 and 5,366,638; Philadelphia 554,507 and 498,531, 74.81 to 66.97, net -80,954 of -394,240; Cumberland +0.99 | cycle_change.csv (PA, SEN) |
| Pennsylvania governor | Philadelphia 75.72 and 72.58; vote share 11.055 and 9.286 percent | data/baselines/benchmarks_2026.csv (PA, GOV) |
| Michigan | statewide 9.57 and 10.19; net change +44,884; Oakland +42,784, 16.96 to 23.08; Wayne 659,859 and 606,144 votes, net -25,033; other 81 counties +27,133; MEDSL total 4,431,811 and 54.24 percent against RCP’s 54.5 | cycle_change.csv (MI, GOV); data/clean/statewide_results.csv; data/raw/expectations/expectations.csv |
| Minnesota precincts | 4,074 precincts in 2022, 3,776 matched, 87.4 percent of votes; 476 Hennepin and Ramsey precincts, median +5.2, vote-weighted +3.6, 27.3 percent toward R; 3,268 others with 10 or more votes, median -11.8, 84.1 percent toward R | data/clean/precinct_match_rates.csv; data/clean/precinct_matched/MN.csv.gz; fig. 4 |
| 2018 forecasts | 538 mean absolute miss 3.14 over 20 races, mean signed -0.04, 12 above and 8 below zero; largest misses toward R: MI Senate -7.8, OH Senate -6.3, OH governor -5.6, IA governor -4.8; Stabenow forecast 14.33, result 6.50; Brown 13.16 and 6.82; Cordray 1.85 and -3.74; Hubbell 2.02 and -2.73; Kansas +5.1, Texas governor +5.3, South Carolina +7.3 | data/baselines/expectations_vs_results.csv |
| 2022 polls and forecasts | RCP: 10 of 13 understated D, mean signed +2.89 over all 13; Whitmer avg +1.0, Hassan +1.4, Oz +0.4; 538: 14 of 20, mean signed +1.06 over all 20; DeWine -3.6, Pillen -6.4 against 538; Walz RCP +4.3, 538 +8.91 | expectations_vs_results.csv |
| Watch-list table | generated, not typed | data/baselines/watchlist_2026_senate.md from pipeline/watchlist.py |
Pre-election expectations: FiveThirtyEight’s Deluxe forecast files for 2018 and 2022 (CC BY 4.0), read from Wayback Machine copies because the live site now redirects to abcnews.com, using the last forecast dated on or before election day; RealClearPolitics’ final averages and final results through the RCP data connector. The exact URLs are in data/raw/expectations/SOURCES.md. Six RCP averages reported with no polls in them are excluded. Races where a Democrat-minus-Republican margin does not describe the contest (Maine’s 2018 Senate race, won by Angus King, an independent; Alaska’s 2022 ranked-choice races) are excluded from every margin comparison.
Not yet done: a boundary check of the precinct matches against VEST shapefiles; county results for 2010 and 2014; prediction-market prices; a precinct crosswalk for Pennsylvania and Michigan, whose precinct names do not match across the two cycles.
Changelog
- Published.
Hesitation Media sends new records to the newsletter first. Subscribe on Substack.